Overview
The goal of the project was to design a module called Insights. This Project deals with Primeroedge 2.0 which relates to nutrituion of students in schools. This project was completed in one phase called release 5.0 and completed sucessfully.
Scope: Interactive Design Course
Duration: 18 months
Tools: Figma
Role: Concept, Wireframes, Prototype
Clarify & Ideate


MY CONTRIBUTION
Since I started working on a new module in this project, I made a lot of discussion’s with the data team regarding the students insights in every school, once I got the data from them, I started discussion with product owner regarding the requirements and made my designs. Since I was the only designer on the project so everything you see I created myself. I was involved in everything from defining the Icons and personas, creating flows and wireframes, all the way to creating final UI designs as well as designing the logo of Insight.
//Preparing Research Materials
Quantitative methods gather numerical data and include surveys, analytics, and A/B testing. Qualitative methods provide in-depth insights into user behaviors and attitudes and include interviews, focus groups, and usability testing.
//Conducting Research
I Conducted in-depth interviews with individual users to explore their experiences, motivations, and pain points,Build rapport, ask open-ended questions, and probe deeper based on user responses and Distribute surveys to a large audience to gather quantitative data on user behaviors and preferences, Kept surveys concise, used a mix of question types, and ensure questions are clear and unbiased.
//Analyze Data
Used statistical methods to analyze survey results and other numerical data, looking for trends and patterns.Transcribed interviews and focus group discussions, then code the data to identify common themes and insights. Summarized the most important findings from my research, highlighting key user needs, pain points, and behaviors.
Development Phase
After we defined the flow and thus what screens we needed I proceeded with creating the wireframes to explore the experience in more detail on a screen-by-screen level. The main focus was the ICC Dashboard Desktop version which sits at the heart of the Module.
Next I moved to exploring the overall look of the Module. I did this by creating 3 landing page mock-ups using the same layout but different styles. Taking this route instead of creating mood boards helped communicate different directions we can take more vividly as the client could clearly see the impact each direction would have.
//Low-Fidelity Sketches
Started with basic hand-drawn sketches or rough digital sketches to brainstorm ideas and layout concepts, and Quickly iterate on different layout ideas to explore various approaches. Mostly I worked on Figma and FigJam tools in this project based on project needs and team preferences. Focused on the overall layout, including placement of elements like headers, footers, navigation, and content areas and Avoided using colors, images, or detailed styling at this stage. Map out user flows to ensure a logical and intuitive navigation structure and Included annotations or notes to explain interactions and user pathways.Once the process is done, I Shared the wireframes with team members and stakeholders for feedback and Made necessary adjustments based on the feedback to improve usability and alignment with project goals.
//High-Fidelity Wireframes
Added more detail to the wireframes, including more precise layout and spacing and Refined the wireframes based on user testing and stakeholder input. Conducted usability testing with real users to validate the wireframes and Gathered feedback on the flow, structure, and overall user experience. Later documented the wireframes with detailed annotations and descriptions to ensure the wireframes are easy to understand for developers and other stakeholders.
//Transition to Prototyping
Used the high-fidelity wireframes as a foundation for creating interactive prototypes and Prototypes will help in further validating the design and refining interactions before moving into development.


Implementation Phase
I ran a card sorting session that was composed of members from our Sales and Support teams. I used this technique to determine which functionalities of the dashboard should stay, be relocated or be eliminated based on our platform’s information architecture and how much value it was adding on our dashboard.
I sent out a survey to our client-facing teammates to quickly inquire what should be added or removed from our dashboard. The purpose of this was to discover potential quick wins on simple improvements that could be executed quickly.
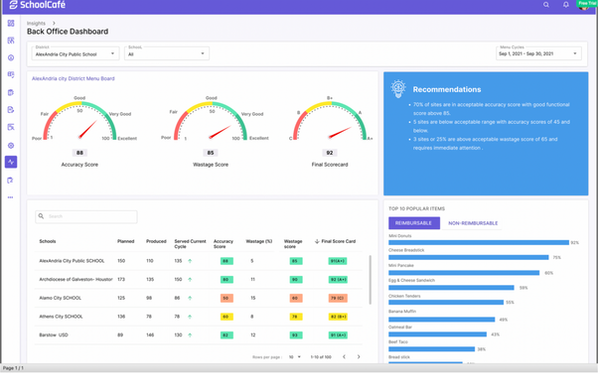
Final UI
After the module was complete, I proceeded with designing the final landing page and user interface for desktop version. I shared all Prototypes and mockups to UI developement team and worked along with them until we got the final output.

