Scope: Internal application called IBG
Tools: Figma
Role: Concept, Wireframes, Prototype
Overview
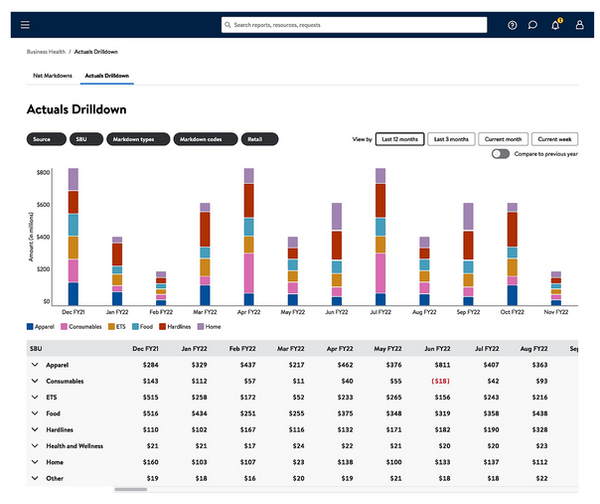
Intelligent Business Growth is a self reporting tool designed for walmart users to connect with numerous reports generating in walmart organization. In this application it helped me deepen my knowledge in user expereince design and explore approaches more on e-commerce sector. I was the sole designer on the team called Workstream B, utilized Power BI to collect and analyze essential data reports, translating raw data insights into strategic information that informed the design of IBG .which deals with the Network markdowns reports. Leveraged Power BI insights to drive design decisions, ensuring that the internal tool met business requirements and provided key stakeholders with valuable, real-time data visibility.
Problem statement
Walmart’s internal employees faced challenges managing and leveraging business growth opportunities due to fragmented tools, inefficient workflows, and a lack of actionable insights. The existing systems failed to provide a centralized platform for analyzing data, collaborating across teams, and making informed decisions. As a result, employees struggled to identify growth trends, optimize operations, and align with organizational goals efficiently. The Intelligent Business Growth (IBG) application aimed to address these gaps by delivering an intuitive, data-driven tool that streamlined workflows, enhanced collaboration, and empowered employees to make impactful decisions for sustained business growth.
Clarify Phase
The clarify stage began with identifying the key pain points experienced by Walmart’s internal employees and understanding the broader organizational goals that the Intelligent Business Growth (IBG) application needed to address. Through stakeholder interviews, we explored the strategic vision behind IBG and the challenges faced by teams in their day-to-day operations. Stakeholders highlighted the fragmented nature of existing tools, which created inefficiencies and data silos. Employees were often burdened with manual processes for gathering and interpreting growth-related data, making it difficult to derive actionable insights. The goal was clear: to design a centralized, user-friendly tool that integrated data visualization, predictive analytics, and streamlined workflows to drive smarter business decisions.
To gain deeper insights into user needs, we conducted interviews and surveys with employees from various departments, including business analysts, operations managers, and team leads. These sessions revealed key frustrations, such as difficulty accessing relevant data, inconsistency in reporting formats, and limited collaboration features within the existing systems. Additionally, employees expressed the need for a tool that could adapt to diverse workflows and skill levels, as technical proficiency varied widely among users. To address these insights, we created detailed user personas representing the primary employee roles, each with unique needs, goals, and challenges. These personas served as a foundational guide for designing user-centered solutions.
Finally, we analyzed existing workflows and tools to uncover inefficiencies and areas for improvement. We conducted task analyses and process mapping sessions with employees to identify bottlenecks and redundant steps in their workflows. This evaluation helped us outline opportunities for automation and integration, ensuring that the IBG application could deliver value through increased efficiency and collaboration. By the end of the clarify stage, we had a well-defined problem statement, a clear understanding of user needs, and a prioritized list of objectives to address through design. These insights formed the groundwork for the ideation and design phases, ensuring the project was aligned with both business goals and user expectations.
Ideate Phase
In the ideate phase, the focus was on generating innovative and practical ideas to address the challenges identified during the clarify stage. We began with collaborative brainstorming sessions involving cross-functional teams, including product managers, engineers, and end-users. These sessions encouraged participants to propose diverse solutions, ensuring a broad spectrum of ideas.
To generate innovative solutions systematically, we employed the Function-Follows-Form (FFF) principle from the SIT methodology. Instead of focusing solely on user needs initially, this approach encouraged us to alter existing elements of the system to uncover creative solutions. We used Task Unification and Division as key SIT tools. In the brainstorming sessions, Task Unification led us to combine multiple functions into single components, such as integrating predictive analytics directly into dashboards to provide instant insights without requiring users to switch between tools. Similarly, using the Division technique, we deconstructed complex workflows into simpler, modular steps, enabling users to complete tasks incrementally and with greater clarity. For instance, we proposed separating data aggregation, analysis, and visualization into distinct yet connected modules within the application.
The application of these methodologies enabled us to reimagine processes and prioritize simplicity and flexibility. Prototypes created through this lens reflected optimized workflows and innovative design elements that might not have emerged through traditional ideation alone. Feedback sessions with stakeholders and employees confirmed the value of these solutions, as they addressed key pain points such as fragmented tools and time-consuming tasks. This structured approach not only fueled creativity but also ensured alignment with the business's technical and operational constraints, providing a robust foundation for prototyping in the next phase.


FONTS
Living Design system & UI Components
Started by thoroughly reviewing the design system’s documentation called Living design system. This includes understanding the principles, guidelines, and components outlined in the system.
Familiarized myself with the design components, patterns, and styles available. Paid attention to UI elements like buttons, input fields, typography, colors, and spacing.
BRAND ADJECTIVE
-
green
-
energetic
-
knowledgeable
-
fresh
-
modern
-
Avenir Next Regular - 20 This is a Header
-
Avenir Next Regular - 16 This is body and button text
-
Avenir Next Regular - 12 This is body text
-
AVENIR NEXT REGULAR UPPERCASE - 10 THIS IS LABEL TEXT
Accessibility & Consistency
While Designig for accessibility, I ensured that this product can be used by people with various disabilities. This includes considerations for visual, auditory, and motor impairments.
Followed web accessibility standards such as WCAG (Web Content Accessibility Guidelines) to ensure your product is accessible to all users. Used consistent design patterns and elements throughout the product to provide a cohesive user experience. Ensured that my design aligns with the brand’s visual identity and style guidelines to maintain consistency with other company products and communications.


Development Phase
Low-fidelity wireframes
The development phase involved close collaboration between the design and engineering teams to transform the high-fidelity prototypes into a functional Intelligent Business Growth (IBG) application. To ensure a seamless transition, we began by creating detailed design specifications, including style guides, component libraries, and annotated wireframes. These artifacts provided developers with clear instructions on implementing UI elements, maintaining consistency with the approved design. Additionally, we organized a series of design handoff meetings to walk engineers through critical user flows, clarify interactions, and address technical concerns before coding began. These sessions fostered alignment and reduced the risk of misinterpretation during development.
A significant part of this phase was maintaining constant communication with the engineering team to address challenges arising from technical constraints. For instance, while integrating real-time data visualization, developers encountered limitations in the application’s processing capabilities. To overcome this, we worked collaboratively to optimize the design by simplifying certain visual elements without compromising usability or functionality. Regular design reviews were conducted at sprint intervals, allowing us to assess progress, identify inconsistencies, and make necessary adjustments. This iterative feedback loop ensured that the final product stayed true to the user-centered vision while accommodating practical limitations.
We also conducted extensive Design QA (Quality Assurance) to verify that the implemented designs matched the specifications and provided a seamless user experience. This process involved testing various aspects of the application, such as responsiveness across devices, accessibility compliance, and consistency in visual hierarchy. Special attention was given to edge cases, such as how the application behaved with incomplete data or under heavy traffic. These scenarios were meticulously tested, and the feedback was documented and shared with the development team for resolution. This collaborative effort resulted in a polished application that was both robust and user-friendly.
As the development phase neared completion, we prepared for the application's launch by creating comprehensive onboarding resources, including training materials and in-app guides for internal employees. These resources were designed to familiarize users with the application’s features and encourage adoption. Post-launch, we remained actively involved, collecting real-world user feedback and collaborating with the development team to implement updates and fixes. This phase not only brought the design vision to life but also laid the groundwork for future enhancements, ensuring the IBG application could evolve alongside Walmart’s business needs.
Rapid Prototyping
Using tools like Figma, we developed low- to mid-fidelity wireframes that represented key features, such as customizable dashboards, data visualizations, and predictive analytics modules. These prototypes were shared with stakeholders and end-users for usability testing, allowing us to gather feedback on navigation, layout, and functionality early in the process. Iterative improvements based on user insights ensured that the tool addressed employee pain points effectively while aligning with Walmart’s operational requirements. This agile approach minimized risks, enhanced collaboration across teams, and helped us deliver a user-centered solution that met both employee and organizational goals.


Implementation Phase
To handle the implementation, I first collaborated with the training team to design an onboarding experience tailored to Walmart's diverse employee base. This involved creating in-app tutorials, interactive walkthroughs, and a comprehensive user guide to familiarize employees with key features. We also conducted live training sessions and Q&A workshops to address specific user queries. Recognizing the varied technical proficiency among employees, I ensured that the resources were clear, accessible, and designed to build confidence in using the tool effectively.
Post-launch monitoring played a significant role in understanding the application's performance and user adoption. We established a feedback loop through surveys, support tickets, and focus groups to collect insights on user experiences. This feedback helped identify usability issues, feature gaps, and areas of friction in the workflows. For example, early feedback revealed that users wanted quicker access to frequently used tools, prompting us to prioritize a dashboard customization feature in subsequent updates. I worked closely with the development team to address critical issues and roll out incremental updates, ensuring that the application continuously evolved to meet user needs.
Additionally, I partnered with data analysts to track key performance indicators (KPIs) such as task completion times, error rates, and user engagement metrics. These insights allowed us to measure the impact of the IBG application and showcase its value to stakeholders. For instance, a reduction in manual data processing time by 30% highlighted the tool’s efficiency. By maintaining open communication with stakeholders and users throughout the implementation phase, I ensured that the IBG application was not only successfully launched but also positioned for sustained success within Walmart’s internal ecosystem.